Table of contents
Open Table of contents
- Two solutions to associate all record entries with a given initiator
- Trace trees and spans
- Instrumentation point
- Annotation API
- Trace collection
- Security and privacy considerations
- Tracing Overhead
- Adaptive sampling
- Coping with aggresive sampling
- Additional sampling during collection
- General-purpose Dapper Tools
Two solutions to associate all record entries with a given initiator
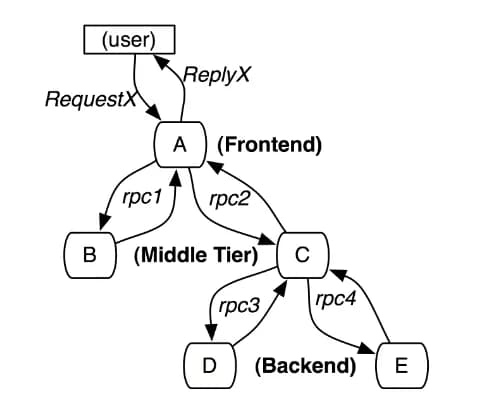
Black-box
use statistical regression techniques to infer that association
- pro: portable
- con: need more data to gain sufficient accuracy due to thier reliance on statistical inference
Annotation-based schemes
ely on applications or middleware to explicitly tag every record with a global identifier that links these message records back to the originating request
-
pro:
-
con: need to instrument programs
- solution: In our environment, since all applications use the same threading model, control flow and RPC system, we found that it was possible to restrict instrumentation to a small set of common libraries
Trace trees and spans
-
a Dapper trace tree
-
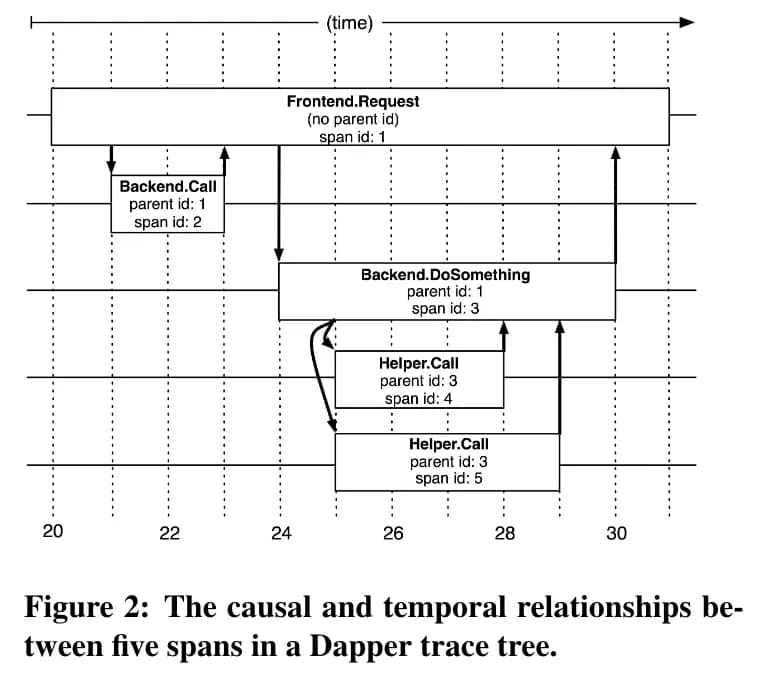
Tree Node: spans
-
Edge: relationship between a span and its parent span
-
-
a single span
-
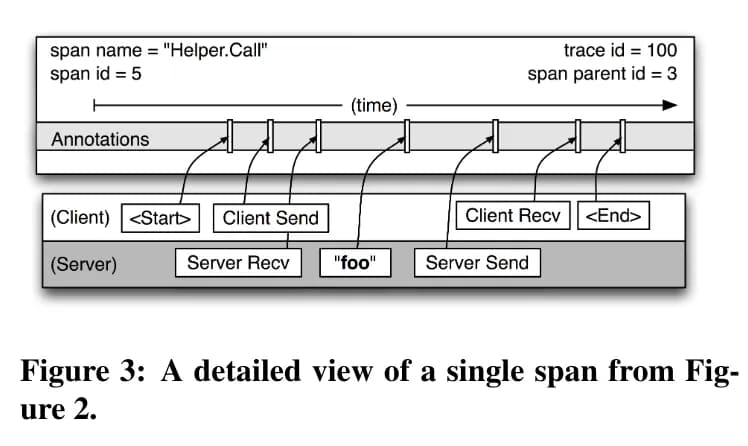
-
Instrumentation point
Entry:
- When a thread handles a traced control path
- Dapper attaches a trace context to thread-local storage
Defer computation or made asynchronous
- all callbacks store the trace context of their creator
- trace context is associated with the appropriate thread when callback is invoked
Inter-process communication
- span and trace ids are transmitted from client to server for traced RPCs
Annotation API
- Textual annotation
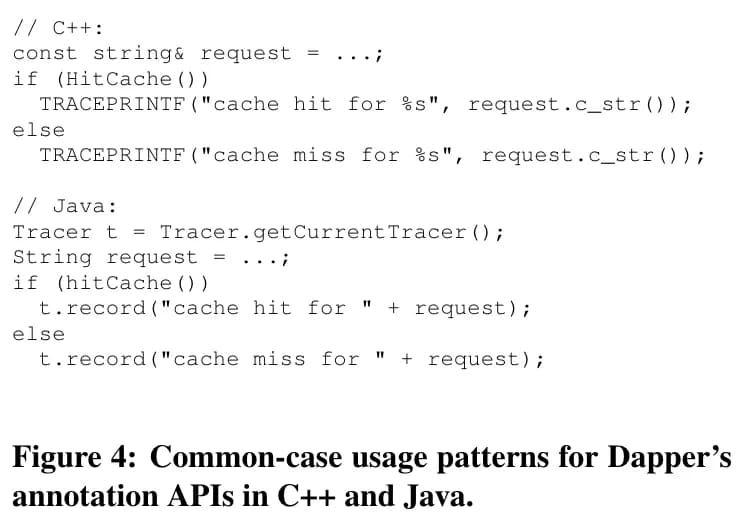
- Key-value annotation
Trace collection
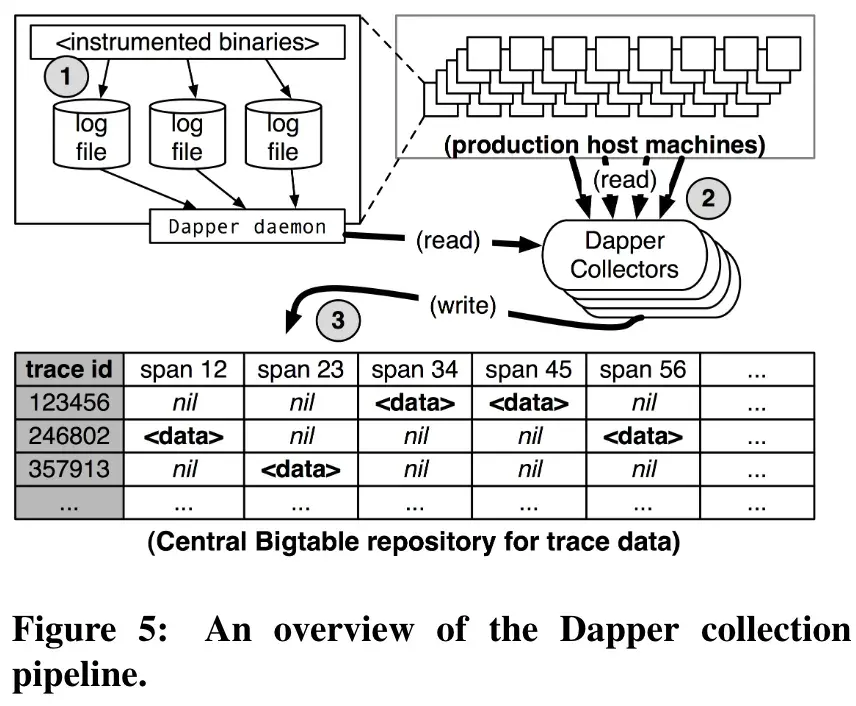
Out-of-band trace collection
The Dapper system as described performs trace logging and collection out-of-band with the request tree itself. Because:
-
in-band collection scheme affect application network dynamics
-
in-band collection schemes assume that all RPCs are perfectly nested
Security and privacy considerations
Default:
- Dapper stores the name of RPC methods but does not log any payload data at this time.
Opt-in:
- application-level annotations to associate any data
Not anticipated benifits:
- monitor whether applications are satisfying security policies through proper levels of authentication
Tracing Overhead
Generation Overhead
Trace generation overhead is the most critical segment of Dapper’s performance footprint, since it can harder be turned off in an emergency.
Most important sources of trace generation overhead:
- creating and destroying spans and annotations and logging them to local disk
Creation time cost(average, measured on a 2.2GHz x86 server):
-
root span: 204 ns
-
non-root span: 176 ns
-
additional span annotation:
- if not sampled for tracing: 9 ns
- if sampled(annotated the trace with a string literal): 40 ns
the difference is the added cost of allocating a globally unique trace id for root spans
Collection overhead
- Dapper daemon is restricted to the lowest possible priority in the kernel scheduler
Effect on production workloads
Adaptive sampling
The Dapper overhead attributed to any given process is proportional to the number of traces that process samples per unit time.
Coping with aggresive sampling
low sampling probabilities - often as low as 0.01% for high-traffic services - does not hinder most important analysis for high-throughput services
If a notable execution pattern surfaces
once in such systems, it will surface thousands of times.
Additional sampling during collection
Why:
- to maintain flexibility around both the material resource requirements and the cumulative Bigtable write throughput
How:
- hash trace id as a scalar z (0 <= z <= 1)
- If z is less than our collection sampling coefficient, we keep the span and write it to the Bigtable
Remark
- higher runtime sampling rate, and throttle that write rate with secondary sampling coefficient in the collection system
General-purpose Dapper Tools
Depot API
to access trace data:
-
access by trace id
-
user function is inovked for every collected trace within a user-specified time window
-
Index access: service name, host machine, ts